How Do I Know How Bad the Air Quality Is?

southeast Asia Haze 2026

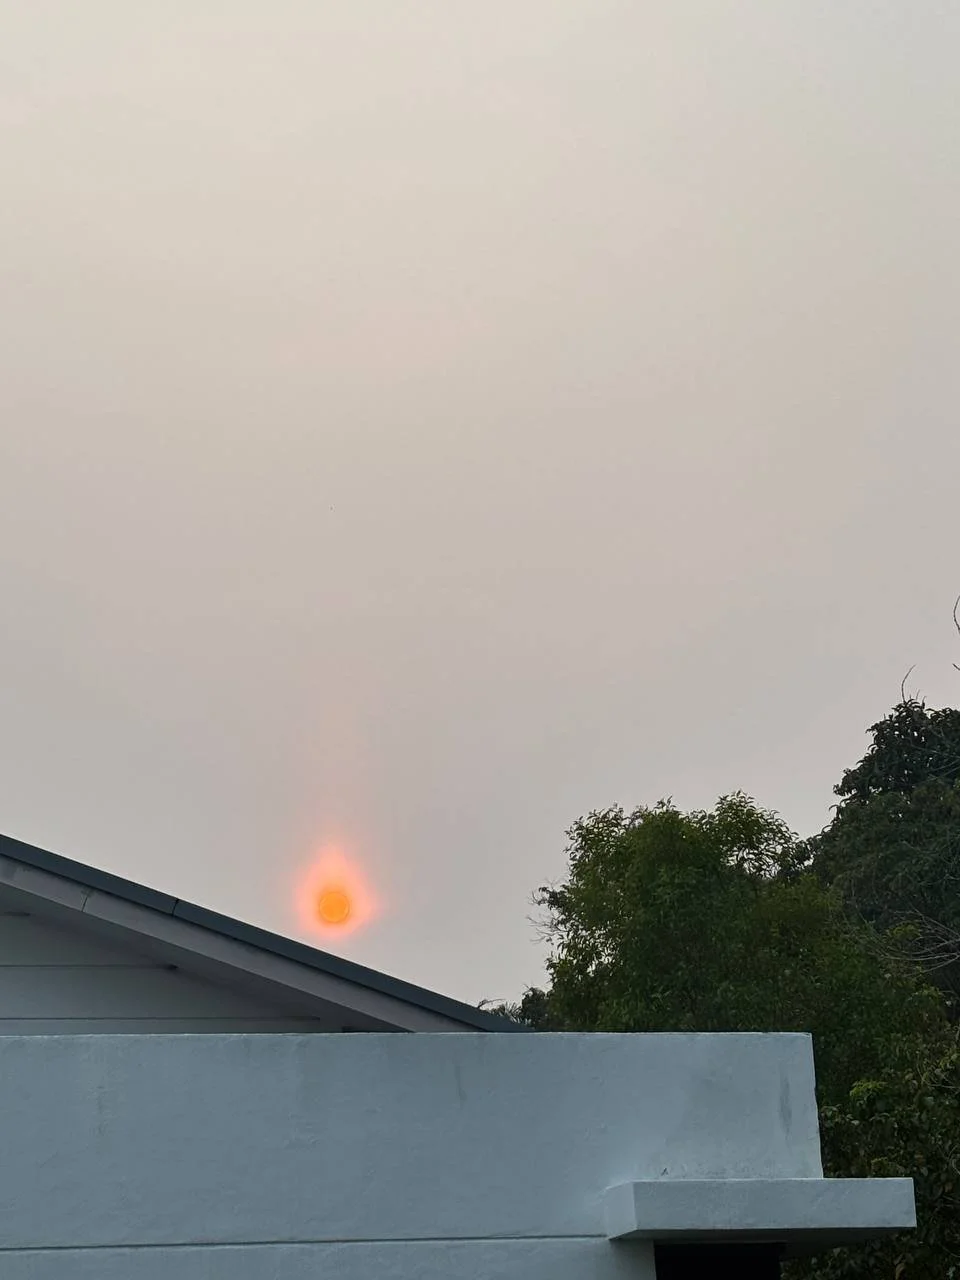
the sun appearing orange in the Haze, september 2026

I shared this picture here. It’s haze season and it is awful this year.

We do not use air-conditioning during the daytime and like to keep most windows open.

If the air is bad, we close the windows. Bad air quality can be obvious, like now when burning begins and “haze season” starts, the air gets really bad (see picture of the orange sun). We can smell it, our eyes smart and lips feel dry.

People are sharing official numbers to and fro to determine which days or even which hours are better to be out.

But what if the difference is not dramatic? What if you’re used to living in general poor air quality?

Various official guidelines say contrasting advice. How do you tell?

On really bad days, I need to decide when it makes sense to open my windows—at all—for fresh air or keep them closed and run an air purifier. How do you compare the Outdoor AQI measurements (like those on purpleair.com) vs. the indoor measurements on an indoor air quality detector (TVOC, HCHO, etc.)

Air Quality Guidelines

It is convenient to rely on the daily news for air quality guidelines. But here is how numbers can be confusing.

For example, the World Health Organisation (WHO) states that a safe 24-hour average exposure should not exceed 15 µg/m³. This is the threshold the WHO adopted after higher levels are associated with increased risks of serious health issues such as respiratory and cardiovascular diseases.

A level of 50 µg/m³ is more than 3 times higher than this safe benchmark. This has been our area for the last 1-2 months, on and off depending on the winds and weather.

That concentration of 50 µg/m³ converts roughly to ~137 on the US Air Quality Index (AQI).

How “unhealthy” is this?

Most scales classify a AQI of 137 (or 50 µg/m³) along a scale from Moderate to Unhealthy for Sensitive Groups. That is, they agree that is not healthy.

How unhealthy? Different global air quality scales calculate this differently.

For example, some regional systems (like Singapore's NEA bands) categorise 0–55 µg/m³ as "Normal". But that does not mean “healthy” either.

"The “Normal” tier guidelines maintain that physical health effects and reactions can still happen.

So we cannot rely on only an index to determine the true quality of air, especially in a given moment. Like whether to open windows to flood the home with hopefully good air, if we’re in a bad location.

Watch out for the PM2.5 

All indexes include six key air pollutants: PM2.5, PM10, ozone, nitrogen dioxide, sulfur dioxide and carbon monoxide.

Arguably a most dangerous component is called the PM2.5.

The PM2.5 counts only particles 2.5 microns or smaller (about 30 times smaller than a human hair). It’s only a raw physical measurement. It stands for fine particulate matter—tiny pieces of dust, soot, or smoke that are 2.5 micrometers or smaller in size.

PM2.5 measurements are in micrograms per cubic meter (μg/m³).

The smaller the particle, the deeper it can penetrate into the respiratory system.

It is difficult to filter. Your home air filter may not display PM2.5 levels.

It is also why indexes like the PSI or the API can differ so much. AQI and µg/m³ are two different measurements.

Converting PM10 or PM2.5 to an index measurement isn’t necessarily about adding them up., You’d need to perform various calculations to convert a concentration measurement to an AQI measurement (keeping in mind the time frame: 10-min, 1-hr, 8-hr, 24-hr, etc).

Southeast Asia haze indexes

Most countries have their own air quality standard on measurement and index. The main differences are in the number of pollutants and levels.

The AQI (used in the US) is different. AQI (Air Quality Index) is a calculated score based on ppm readings and are usually averaged over a specific period. It is a standardized, color-coded scale (usually from 0 to 500). Governments and agencies use these calculations to translate raw pollutant numbers into an easy-to-understand measure of health risk. 

Apart from PM2.5 particles, it measures ozone (O₃), nitrogen dioxide (NO₂), sulfur dioxide (SO₂), and carbon monoxide (CO).

Malaysia’s Environment Department uses an Air Pollutant Index Management System (APIMS), calculated based on several key pollutants, which include PM10 and

Singapore, the National Environment Agency (NEA) uses the Pollutant Standards Index (PSI). It shows a 24-hour rolling average PSI alongside 1-hour PM2.5 concentrations. [1]

It uses only specialised, certified pollutant analysers.

Other indexes may include in lower-cost consumer sensors.

Think of the PM2.5 as only one bag of “goods” in the overall index. 

Local / consumer sensors

Do you live in a ‘low-pollution zone’ in the suburbs but your monitor is showing worse readings?

Consumer grade sensors that are much less accurate and often not calibrated as certified, professional air quality monitors. As far as I know there are only a few high quality air sensors in most neighbourhoods outside of Singapore or Kuala Lumpur. Furthermore, air quality can be a highly localized thing.

Local terrain, vehicle traffic, air flow and local wind patterns, river or lake, amount of trees, vegetation can all affect air quality readings. Or you facing the single road entering your neighbourhood of over a hundred homes,

I’m not saying these are not unhelpful. Far from it, they can give a local warning compared to aggregate data that can be weighted average over a whole day (24-hour period). Those are slower to show big changes. For example, if your neighbourhood is in a low-pollution zone, but the homes face a construction site or a data centre activities.

Such monitors can reveal big differences between parts of a town.

Purple Air shows a network of sensors, many of which are consumer grade. Here are the maps for Singapore and Malaysia.

When a neighbour started sharing his data, I found my nose agreed more with his than the index average published.

Air quality health symptoms

Sometimes your body knows before any number or guideline tells you so.

It is well-established the health effects air pollution can have, from heart problems to fertility issues to low birth weight and birth issues.

Be aware of health risks such as asthma, COPD, or heart disease, as well as children and older adults.

This study showed how, in Singapore, the PSI was significantly associated with an increased risk of mortality. The “haze seasons” across Southeast Asia are awful, but it’s made this point beyond clear. The worse the air is, the likelier you die.

Other symptoms:

  • asthma

  • cough and throat irritation,

  • allergic rhinitis

  • sinus symptoms

  • eye irritation

  • eczema and other skin irritation

I think your body is your biggest clue as how you are doing.

Even if air pollution is not making you sick, it is killing you earlier. Two recent studies prove this; one is from Berkeley (August 2015) (which attributes 4000 deaths a day in China to PM2.5) and the other from Max Planck Institute (September 2015) (3.3 million premature deaths a year due to mostly PM2.5, this is more than Malaria and HIV/Aids combined!).

These studies published by different scientists and countries just a few months apart show how the air pollution issue is underestimated.

The health effects on children is worse. Because children and infants are still developing and are more exposed than we are.

Ella’s Law 

Nine-year-old Ella had a fatal asthma attack in 2013. She became the first person in the UK to have air pollution recognised as a factor in her death.

Ella’s mother knew she suffered the asthma attack after being exposed to excessive air pollution on her daily walks to and from school. The coroner ruled the same. 

The levels of nitrogen dioxide (NO2) near Ella's home had exceeded both World Health Organization and European Union guidelines.

Ella's Law became known as the Clean Air (Human Rights) Bill, requiring the government to meet stricter air quality standards set by the World Health Organization.

When do you close the windows?

The standard advice is to stay indoors, but you can see that this is actually help your health much if you're in a non filtered space.

My advice would be to try to find the best filtered space and stay there. Filter and clean your home frequently.

Or if you feel better with one, wear a proper N95 mask at home.

On fairly good days, open your windows and get that air flowing.

The thing is, if you don't filter, keeping your windows closed may make little difference. You should probably open them to refresh the air. After all, the air you have inside your home is coming from outside, so your indoor air is really outdoor air plus whatever extra contaminants you have indoors.

References and Resources

  1. The WHO air quality guideline (AQG) states that annual average concentrations of PM2.5 should not exceed 5 µg/m3, while 24-hour average exposures should not exceed 15 µg/m 3 more than 3 - 4 days per year. Countries experiencing a haze season are well past these figures.

  2. NO2 is a pollutant from vehicle emissions, industrial activities, and maritime traffic in dense urban and port hubs like the Klang Valley and major peninsular ports. Cities are pretty much often hotspots for poor air quality.

  3. Indexes can be too vast or generalised. Remember when the Chinese netizens started buying their own monitors and publish their measurement on weibo and other social networks.

  4. Some PurpleAir sensors show indoor quality which ought to be better than outdoor quality. Those usually have bold black circles around the color dots. It is eye-opening to see inside vs outside.

  5. Air filters are appropriate for a small room so that they can work well. I run a BlueAir in my bedroom for 1-3 hours before bedtime. This reduces noise and EMF exposure.

  6. Read here to understand how air pollution harms children’s brain development issues (1 & 2); cognitive development issues; overall body development; and lung growth issues (1 & 2).

How Bad Is the Air Pollution at Train Stations and Can It Harm Your Health?

If most of our time is spent indoors, then the next place of significance is our commutes. Many people rely on the public transport system and it may be convenient and ecological. We know the air at these high-traffic urban areas probably is not the best, but how bad is the air pollution and how bad it is for your health?

Studies on Air Pollution at Train Stations

Metro systems play a crucial role in public transportation worldwide. Given that metro stations are unique built environments with a significant volume of daily commuters, ensuring a satisfactory air quality in these spaces becomes paramount.

Small particulates

The general air quality in an urban background already has a particulate matter, but on top of that you have all these extra emissions coming from trains stations. These include particles that come from the carriage moving along the rails, the brake blocks rubbing on the wheels, and the electrical connection between the collector plate and the live rail.

The London Underground, for example, sees up to five million passengers hopping on and off its network. Its 11 lines serve 272 stations, and at peak times there can be over 500 trains hurtling around beneath the streets of London.

All of our fellow passengers, human and otherwise, also contribute to the dust. Hair and skin cells, plastic fibres from clothing, and animal particulates.

Some particles are large enough to be caught by the hairs in our nose and throat, stopping them from getting into our lungs and causing damage there. These are typically referred to as PM10; particulate matter that is under 10 micrometres in diameter, or roughly 0.01mm.

Underground Air Is Worse than Ground-Level

Several studies have reported that particulate matter in underground metro stations were higher than those reported at street-level. In a study of three European metro systems (Barcelona, Athens and Oporto), PM2.5 concentrations in commuter platforms were higher than that in the urban ambient environment (Martins et al., 2016a).

Mean PM2.5 concentrations in underground metro stations in Philadelphia, Pennsylvania, USA, were found to be higher than those at street-level (Shakya et al., 2020).

In Nanjing, China, particle concentrations in underground station concourses were typically higher than those in ambient air (Ji et al., 2021). In Prague, particulate matter concentration levels in the underground metro peaked during rush hour and were found to be highly enriched with iron and other metallic elements during train operating hours (Cusack et al., 2015).

Exposure to Bad Air at Train Stations vs in Cars

While the car isn’t worse than the tube in the case of PM2.5, it is much worse for other pollutants like nitrous oxides.”

It also depends on the design of the train station.

In Singapore, measures such as opting for full-height doors at the platform help maintain air quality on trains and in stations. One study found that PM2.5 levels in the majority of stations exceeded WHO 24-h guideline values.

The PM2.5 & PM10 levels were negatively associated with depth of platforms; the lower the train platforms were underground, the PM2.5, PM10, CO and CO2.

(Being in public areas expose you to other forms of pollution too, such as quats heavily found in almost all typical cleaning supplies. Tube trains and stations are cleaned with hospital-grade cleaning substances that are graded “anti-bacterial”. But this is another article.)

Studies on Indoor Air Quality and Sick-Building Syndrome at Metro Stations

One study looked at the Copenhagen Metro. Ventilation via doors during platform stops caused a drop in observed PM (and CO2) at stations, but the system is surprisingly polluted despite its recent construction.

CO2 mixing ratios ranged from ambient to around 600 ppm. Measures should be taken to control PM levels using a combination of source control and increased clean air supply of the Copenhagen and other similar metro systems.

More Pollution in Low-Humidity Winters

Metro station in Tianjin, China: With a lower relative humidity in winter, the coefficient of friction between railway wheels and rails increased, thus increasing particle emission. The carcinogenic risk of Cr on the platform was unacceptable. Moreover, the health risks induced by Ba should be investigated. The findings indicate that PM control at metro stationss, particularly on platforms in winter, should be emphasized.

Wide Range of Air Pollutants

Study from China, a review of 160 relevant studies performed across over 20 countries: These comprised more than 2000 individual measurement trips. Particulate matters, aromatic hydrocarbons, carbonyls and airborne bacteria have been identified as the primary air pollutants inside metro system:

  1. Fe was found as the most dominant element in the metro PM. Mechanical wear at the brake–wheel and wheel–rail interfaces were commonly recognized as the primary PM source in the metro air.

    As for the gaseous pollutants, benzene, toluene, ethylbenzene, xylene, styrene, formaldehyde, acetaldehyde, acetone and acrolein were mostly found in the metro air. Service time of metro system, frequency of passing train, ventilation mode and airflow rate, the age and air-tightness of the metro train, interior materials, the number of passengers and the ambient pollution level outside the metro stations were identified as the key determinants that could play important roles of influencing the metro air quality.

  2. The concentrations of aromatic VOCs in new metro carriage were 1-2 times lower than that in the old ones, as higher quality paint were used in new trains.

    Less air circulation and ventilation inside underground carriage was likely the reason of higher VOCs levels than the above-ground track. To reduce the exposure levels of air pollutants, PSDs, air purifier unit, high-efficiency air filter seemed to be effective measures. Among these measures, PSDs have been frequently installed in the newly built metro platforms worldwide.

  3. Metro PM showed genotoxicity and ability to induce inflammatory due to large magnetite component. According to the acceptable level proposed by the WorldHealth Organization (1×10⁻⁶–1×10⁻⁵), the life carcinogenic risk of commuters by subway was sometimes above the acceptable level.

Air Pollution --- What You Need to Know

Air is a basic for life. But we take it for granted. Air pollution is a fact of most modern living now, and crosses boundaries across countries and into neighbourhood — it is difficult avoid it completely.

It can have serious health consequences over a lifetime. It's pretty grim reading, with impacts ranging from strokes to mental health issues.

But clean air is becoming increasingly rare. To the point that in some cities in the world, doing just 30 minutes of exercise does more harm than good [4].

In recent decades, the Environmental Protection Agency (EPA) in the United States has had great success in improving air quality. The emission of air toxins has declined 74 percent since 1990 [5].

However, by 2019, 82 million American’s were still living in counties that pollution levels still exceed the National Ambient Air Quality Standards (NAAQS).

  1. Air Pollution Has Been Well Established as Detrimental to Our Health.
    Respiratory and cardiovascular diseases as well as cancer have been linked to air pollution in urban environments [7].

  2. Air Pollution Hurts Cognitive Functions.

    Air pollution acts as a toxin and promotes inflammatory responses, which may cascade into neuroinflammation, dysregulation and neurodegeneration.

    Studies show that air pollution is linked to impaired judgement, mental health problems, poorer performance in school and most worryingly perhaps, higher levels of crime.

    Heavy metals in air is one contaminant that crosses the blood-brain barrier. The air we breathe could be changing our behaviour in ways we are only just beginning to understand.

    In 2011 that Sefi Roth, a researcher at the London School of Economics was pondering the many effects of air pollution. He was well aware of the negative outcome on health, increased hospital admissions and also mortality. But he was staggered to find a clear link between air quality and how well students perform in their examinations! Read more about his study here.

    This can be particularly harmful to children. Researchers at an asthma summer camp found that air pollution was significantly and consistently correlated with acute asthma exacerbations, chest symptoms and lung function decrements [8].

    A slew of studies have looked at air pollution and students’ academic performance in schools: Mohai et al. 2011; Grineski et al. 2020; Lu et al. 2021; Berman et al. 2018) and absenteeism (Berman et al. 2018; Zhang et al. 2022)

  3. Children Are Especially Vulnerable to Air Pollution

    Our young children are most vulnerable to adverse health effects from air pollution due to smaller physiques, faster rates of respiration, and developing organ systems (Legot et al. 2012; Gauderman et al. 2007; Garcia et al. 2021; Calderón-Garcidueñas et al. 2014).

  4. Air Pollution Correlates with Crime and Violence.

    Roth analysed two years of crime data from over 600 of London’s electoral wards, and found that more petty crimes occurred on the most polluted days, in both rich and poor areas.

    We know heavy metals — common in air pollution— is one toxin that predicts more aggressive and violent behaviour in schools.

    Research, led by Jackson Lu of MIT examined nine years of data and covering almost the entire US in over 9,000 cities. It found that “air pollution predicted six major categories of crime”, including manslaughter, rape, robbery, stealing cars theft and assault. The cities highest in pollution also had the highest crime rates. This was another correlational study, but it accounted for factors like population, employment levels, age and gender – and pollution was still the main predictor of increased crime levels.

  5. Air Pollution Can Result in Reduced Productivity.

    This 2016 study backed up the above studies as well as Roth’s initial findings that pollution can result in reduced productivity.

  6. Air Pollution Can Make You Fat.

    So we know two people can eat the same foods, and do the same exercise, but over the course of a few years, one may put on more weight… It is due to an impaired metabolism (basically how your body makes energy), and air pollution is one major contributor to worsening metabolism.

    Traffic fumes and cigarette smoke are the top culprits because their tiny, irritating particles are able to trigger widespread inflammation and disrupt the body’s ability to burn energy.

    “We are starting to understand that the uptake and circulation of air pollution in the body can affect more than just the lungs,” — Hong Chen, a researcher at Public Health Ontario and the Institute of Clinical Evaluative Sciences in Canada.

  7. Particulate Matter (pm2.5) and Nitrogen Dioxide (NO2) - Both of Which Come From Vehicle Exhausts Are Particularly Harmful.

    Fine particulate matter (PM2.5) is comprised of solid and liquid aerosolized particles, so these can deposit deep into the lungs causing oxidative stress and inflammation in several organ systems including the cardiovascular, respiratory, renal, metabolic and neurological systems

    Check out these studies: Bont et al. 2022; Li et al. 2019; Burkart et al. 2022; Delgado-Saborit et al. 2021.

    Researchers couldn’t find any threshold where PM2.5 did no harm, and even those living in the least polluted suburbs of London were affecte.

  8. Very Low Amounts of Carbon Monoxide (Co) Can Impair Brain Functions.

    Other air pollutants target the body via separate pathways.

    For example, carbon monoxide (CO) binds exceedingly well with Hemoglobin in the body. Hemoglobin, essential for oxygen delivery, binds with CO 200–300 times more than with oxygen, preventing oxygen from binding to hemoglobin (Patel et al. 2023)!

    CO is a colorless, odorless, and tasteless gas so carbon monoxide poisoning easily occurs, in which the body experiences severe hypoxia. The symptoms include: a shortness of breath, headache, an altered mental status. Finally, it can lead to death (Patel et al. 2023).

    A study of university students exposed to varying levels of CO revealed even low-level exposure resulted in impaired cognition and visual processing (Amitai et al. 1998).

  9. Nitrogen Dioxide Can Cause Respiratory Diseases.

    NO2 in air pollution irritates the airways, aggravating including asthma (Epa 2022). It also affect the neurological system, as researchers have found associations between NO2 and dementia (Chang et al. 2014)

  10. more than half of the world’s population now live in urban environments – and more of us are travelling in congested areas than ever before.

References and resources:

Rau AT, Harding AB, Ryan A, Ramirez MR, Renner LM, Berman JD. Ambient air pollution and the risk of violence in primary and secondary school settings: a cross-sectional study. Inj Epidemiol. 2024 Jun 13;11(1):24. doi: 10.1186/s40621-024-00512-6. PMID: 38867329; PMCID: PMC11170797.