
How Do I Know How Bad the Air Quality Is?
/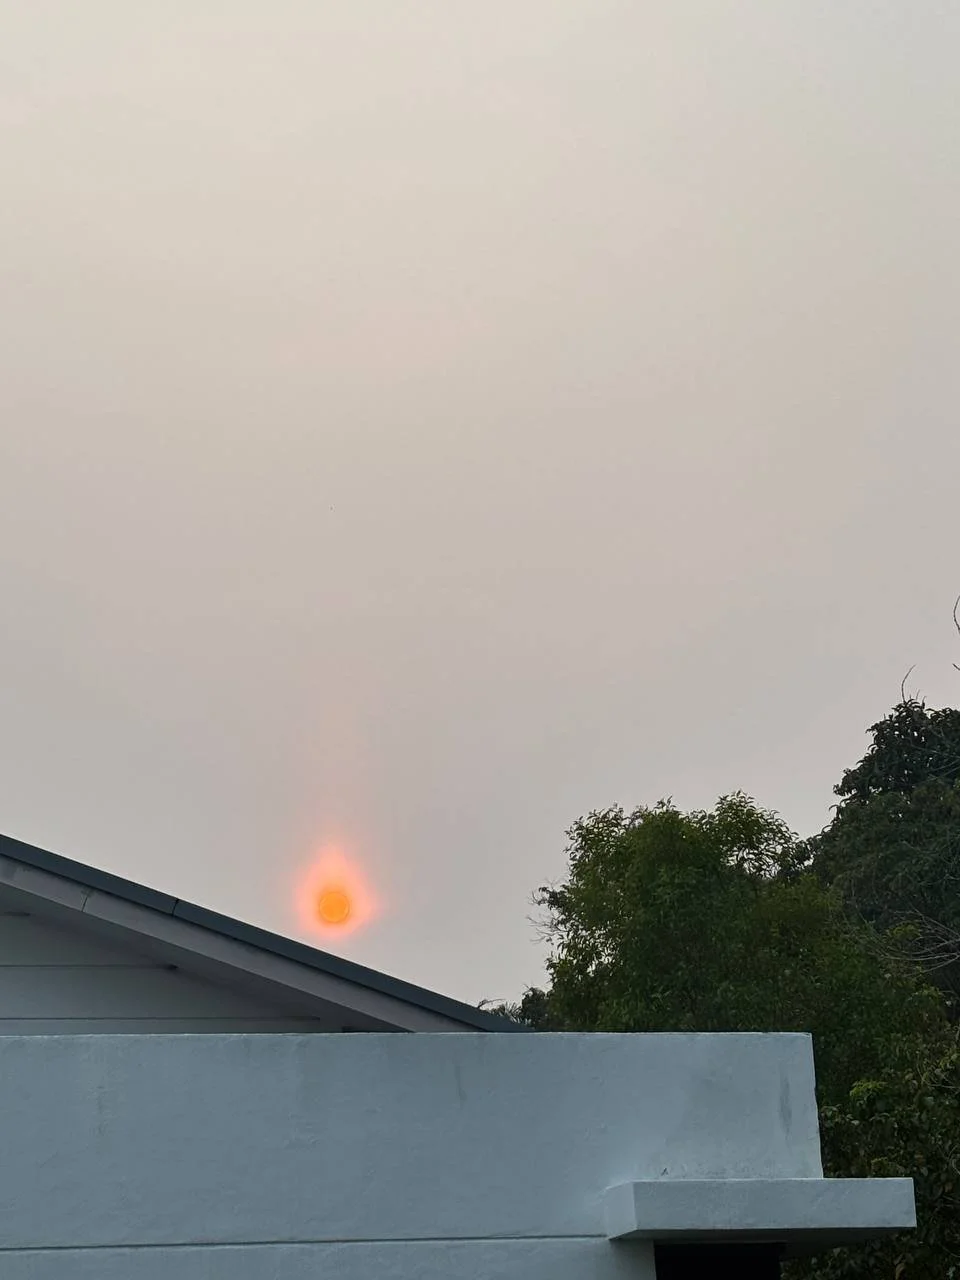
the sun appearing orange in the Haze, september 2026
I shared this picture here. It’s haze season and it is awful this year.
We do not use air-conditioning during the daytime and like to keep most windows open.
If the air is bad, we close the windows. Bad air quality can be obvious, like now when burning begins and “haze season” starts, the air gets really bad (see picture of the orange sun). We can smell it, our eyes smart and lips feel dry.
People are sharing official numbers to and fro to determine which days or even which hours are better to be out.
But what if the difference is not dramatic? What if you’re used to living in general poor air quality?
Various official guidelines say contrasting advice. How do you tell?
On really bad days, I need to decide when it makes sense to open my windows—at all—for fresh air or keep them closed and run an air purifier. How do you compare the Outdoor AQI measurements (like those on purpleair.com) vs. the indoor measurements on an indoor air quality detector (TVOC, HCHO, etc.)
Air Quality Guidelines
It is convenient to rely on the daily news for air quality guidelines. But here is how numbers can be confusing.
For example, the World Health Organisation (WHO) states that a safe 24-hour average exposure should not exceed 15 µg/m³. This is the threshold the WHO adopted after higher levels are associated with increased risks of serious health issues such as respiratory and cardiovascular diseases.
A level of 50 µg/m³ is more than 3 times higher than this safe benchmark. This has been our area for the last 1-2 months, on and off depending on the winds and weather.
That concentration of 50 µg/m³ converts roughly to ~137 on the US Air Quality Index (AQI).
How “unhealthy” is this?
Most scales classify a AQI of 137 (or 50 µg/m³) along a scale from Moderate to Unhealthy for Sensitive Groups. That is, they agree that is not healthy.
How unhealthy? Different global air quality scales calculate this differently.
For example, some regional systems (like Singapore's NEA bands) categorise 0–55 µg/m³ as "Normal". But that does not mean “healthy” either.
"The “Normal” tier guidelines maintain that physical health effects and reactions can still happen.
So we cannot rely on only an index to determine the true quality of air, especially in a given moment. Like whether to open windows to flood the home with hopefully good air, if we’re in a bad location.
Watch out for the PM2.5
All indexes include six key air pollutants: PM2.5, PM10, ozone, nitrogen dioxide, sulfur dioxide and carbon monoxide.
Arguably a most dangerous component is called the PM2.5.
The PM2.5 counts only particles 2.5 microns or smaller (about 30 times smaller than a human hair). It’s only a raw physical measurement. It stands for fine particulate matter—tiny pieces of dust, soot, or smoke that are 2.5 micrometers or smaller in size.
PM2.5 measurements are in micrograms per cubic meter (μg/m³).
The smaller the particle, the deeper it can penetrate into the respiratory system.
It is difficult to filter. Your home air filter may not display PM2.5 levels.
It is also why indexes like the PSI or the API can differ so much. AQI and µg/m³ are two different measurements.
Converting PM10 or PM2.5 to an index measurement isn’t necessarily about adding them up., You’d need to perform various calculations to convert a concentration measurement to an AQI measurement (keeping in mind the time frame: 10-min, 1-hr, 8-hr, 24-hr, etc).
Southeast Asia haze indexes
Most countries have their own air quality standard on measurement and index. The main differences are in the number of pollutants and levels.
The AQI (used in the US) is different. AQI (Air Quality Index) is a calculated score based on ppm readings and are usually averaged over a specific period. It is a standardized, color-coded scale (usually from 0 to 500). Governments and agencies use these calculations to translate raw pollutant numbers into an easy-to-understand measure of health risk.
Apart from PM2.5 particles, it measures ozone (O₃), nitrogen dioxide (NO₂), sulfur dioxide (SO₂), and carbon monoxide (CO).
Malaysia’s Environment Department uses an Air Pollutant Index Management System (APIMS), calculated based on several key pollutants, which include PM10 and
Singapore, the National Environment Agency (NEA) uses the Pollutant Standards Index (PSI). It shows a 24-hour rolling average PSI alongside 1-hour PM2.5 concentrations. [1]
It uses only specialised, certified pollutant analysers.
Other indexes may include in lower-cost consumer sensors.
Think of the PM2.5 as only one bag of “goods” in the overall index.
Local / consumer sensors
Do you live in a ‘low-pollution zone’ in the suburbs but your monitor is showing worse readings?
Consumer grade sensors that are much less accurate and often not calibrated as certified, professional air quality monitors. As far as I know there are only a few high quality air sensors in most neighbourhoods outside of Singapore or Kuala Lumpur. Furthermore, air quality can be a highly localized thing.
Local terrain, vehicle traffic, air flow and local wind patterns, river or lake, amount of trees, vegetation can all affect air quality readings. Or you facing the single road entering your neighbourhood of over a hundred homes,
I’m not saying these are not unhelpful. Far from it, they can give a local warning compared to aggregate data that can be weighted average over a whole day (24-hour period). Those are slower to show big changes. For example, if your neighbourhood is in a low-pollution zone, but the homes face a construction site or a data centre activities.
Such monitors can reveal big differences between parts of a town.
Purple Air shows a network of sensors, many of which are consumer grade. Here are the maps for Singapore and Malaysia.
When a neighbour started sharing his data, I found my nose agreed more with his than the index average published.
Air quality health symptoms
Sometimes your body knows before any number or guideline tells you so.
It is well-established the health effects air pollution can have, from heart problems to fertility issues to low birth weight and birth issues.
Be aware of health risks such as asthma, COPD, or heart disease, as well as children and older adults.
This study showed how, in Singapore, the PSI was significantly associated with an increased risk of mortality. The “haze seasons” across Southeast Asia are awful, but it’s made this point beyond clear. The worse the air is, the likelier you die.
Other symptoms:
asthma
cough and throat irritation,
allergic rhinitis
sinus symptoms
eye irritation
eczema and other skin irritation
I think your body is your biggest clue as how you are doing.
Even if air pollution is not making you sick, it is killing you earlier. Two recent studies prove this; one is from Berkeley (August 2015) (which attributes 4000 deaths a day in China to PM2.5) and the other from Max Planck Institute (September 2015) (3.3 million premature deaths a year due to mostly PM2.5, this is more than Malaria and HIV/Aids combined!).
These studies published by different scientists and countries just a few months apart show how the air pollution issue is underestimated.
The health effects on children is worse. Because children and infants are still developing and are more exposed than we are.
Ella’s Law
Nine-year-old Ella had a fatal asthma attack in 2013. She became the first person in the UK to have air pollution recognised as a factor in her death.
Ella’s mother knew she suffered the asthma attack after being exposed to excessive air pollution on her daily walks to and from school. The coroner ruled the same.
The levels of nitrogen dioxide (NO2) near Ella's home had exceeded both World Health Organization and European Union guidelines.
Ella's Law became known as the Clean Air (Human Rights) Bill, requiring the government to meet stricter air quality standards set by the World Health Organization.
When do you close the windows?
The standard advice is to stay indoors, but you can see that this is actually help your health much if you're in a non filtered space.
My advice would be to try to find the best filtered space and stay there. Filter and clean your home frequently.
Or if you feel better with one, wear a proper N95 mask at home.
On fairly good days, open your windows and get that air flowing.
The thing is, if you don't filter, keeping your windows closed may make little difference. You should probably open them to refresh the air. After all, the air you have inside your home is coming from outside, so your indoor air is really outdoor air plus whatever extra contaminants you have indoors.
References and Resources
The WHO air quality guideline (AQG) states that annual average concentrations of PM2.5 should not exceed 5 µg/m3, while 24-hour average exposures should not exceed 15 µg/m 3 more than 3 - 4 days per year. Countries experiencing a haze season are well past these figures.
NO2 is a pollutant from vehicle emissions, industrial activities, and maritime traffic in dense urban and port hubs like the Klang Valley and major peninsular ports. Cities are pretty much often hotspots for poor air quality.
Indexes can be too vast or generalised. Remember when the Chinese netizens started buying their own monitors and publish their measurement on weibo and other social networks.
Some PurpleAir sensors show indoor quality which ought to be better than outdoor quality. Those usually have bold black circles around the color dots. It is eye-opening to see inside vs outside.
Air filters are appropriate for a small room so that they can work well. I run a BlueAir in my bedroom for 1-3 hours before bedtime. This reduces noise and EMF exposure.
Read here to understand how air pollution harms children’s brain development issues (1 & 2); cognitive development issues; overall body development; and lung growth issues (1 & 2).


